
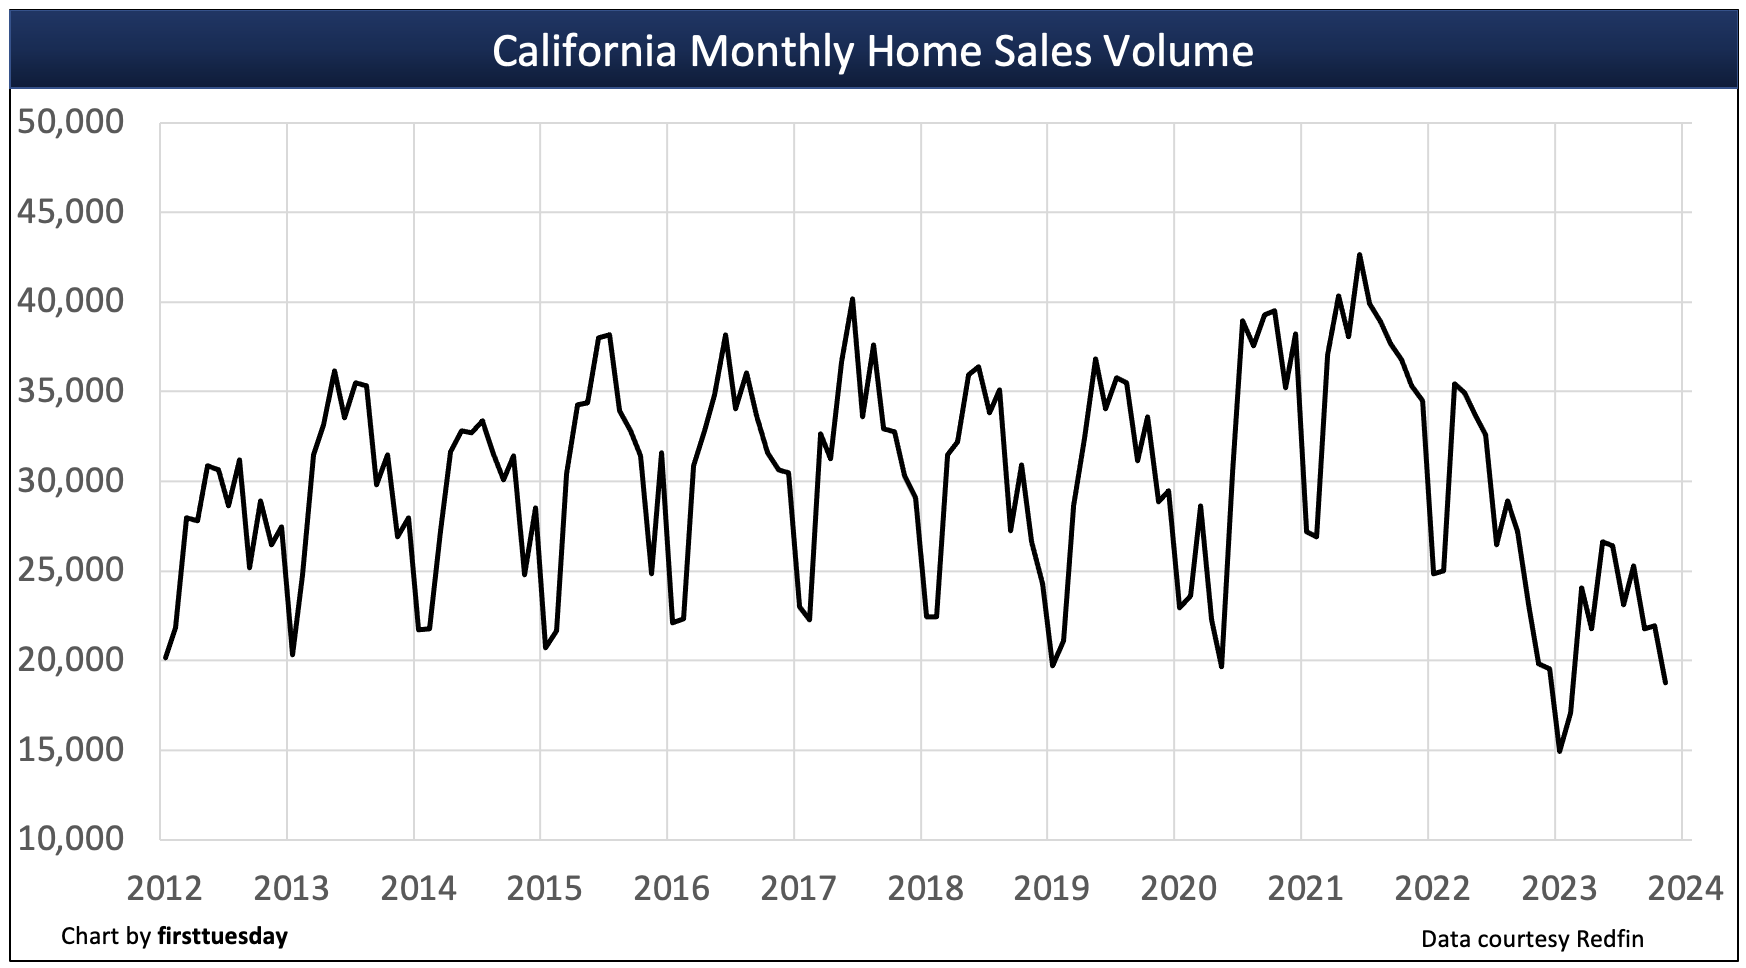
Just 18,800 new and resale home transactions closed escrow in California during November 2023. Home sales volume was down 14% from the prior month and down 7% from a year earlier, when sales volume was just starting its downward path, which continues today.
Further, sales volume year-to-date (YTD) is a fee-crushing 23% below a year ago. Compared to 2019 — the last year before pandemic volatility took over — sales volume YTD in November 2023 is 28% lower.

Buy/sell, rent/lease residential &
commercials real estate properties.
Annual home sales in 2022 experienced a 24% decrease from 2021. More critically, sales volume in 2022 was 12% below 2019 — the last year to experience a typical seasonal sales cycle.
During 2021, historically low interest rates and buyer fear of missing out (FOMO) escalated housing market sales activity, cannibalizing future sales while inflating prices. With the pandemic fuel depleted, sales volume collapsed in early 2022. Absent this momentum, sales volume peaked early in March 2022, this volatility now being repeated in 2023.
2023 was a year of overall weakening for California home sales volume as the supply of homebuyers was exhausted during the pandemic buying spree. Other buyers know the math and will only buy when prices stop dropping.
Watch for home sales volume to continue trailing in 2024. Without the support of a steady rush of home sales, home prices have resumed their decline, causing recent mortgaged homebuyers to dive underwater. Expect a return of real estate speculators by 2025 to provide a “dead cat” bounce during the ongoing sales slump, with a sustainable recovery taking off with the return of end user homebuyers around 2026-2027.
Updated January 3, 2024. Original copy posted March 2009.
Chart 1
Chart update 01/03/24
|
Nov 2023 |
Nov 2022 |
YoY change |
|
| California home sales volume |
18,800 |
20,200 |
-7% |
Home sales vary from month-to-month for a variety of reasons, most significant being homebuyer demand. This demand is influenced by several factors constantly at work in California’s homebuying market, including:
- seasonal differences [see Chart 2];
- changes in home prices;
- mortgage interest rates;
- consumer confidence;
- the presence of investors and real estate speculators in the market;
- negative equity status;
- the quantity and quality of jobs held by homebuyers; and
- homebuyer saving rates.
Seasonal differences in annual sales volume
It’s normal for home sales volume to rise in the first half of the year and fall after June, generally speaking.
Chart 2
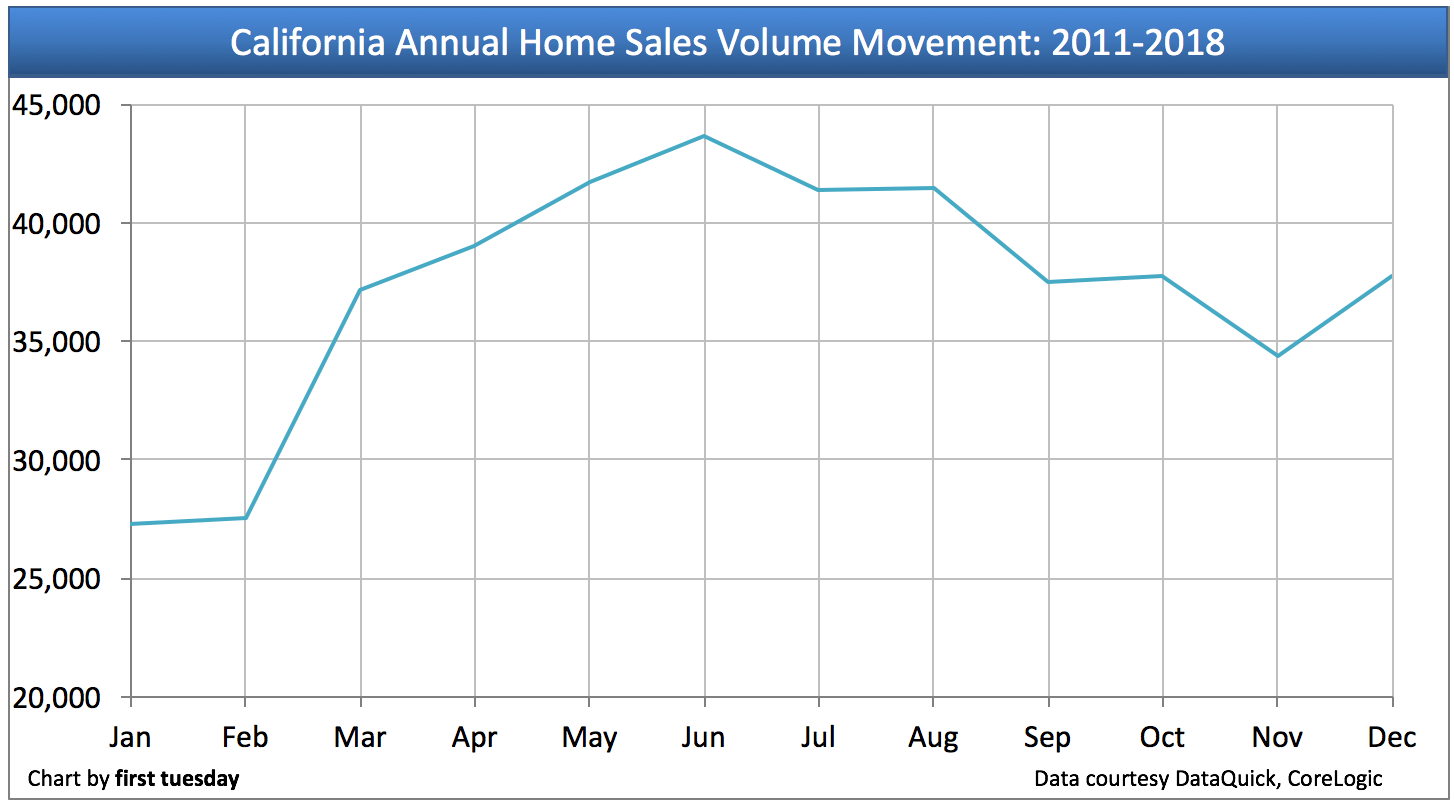
Chart update 02/02/19
Chart 2 shows average home sales as experienced from 2011-2018. As depicted, the most homes are regularly sold each year in June. Another small increase takes place in December, as homebuyers seek to wrap up their financial activities before the end of the year.
Therefore, real estate professionals are not to worry when they hear of falling sales volume in the latter half of the year. This is a normal seasonal progression. What to watch for is year-over sales comparing a month or other period (such as year-to-date) this year with the same month or period last year.
The ongoing recovery for home sales volume
Annual real estate sales numbers since the Great Recession of 2008 have been characterized by a continuing bumpy plateau in home sales volume, now experienced for over a decade. As a rule, current market action, whether up or down, is reflected first in sales volume, followed by prices, and both fluctuate from month to month mostly going in opposite directions or just standing still.
2021 was the first year to see a significant increase in annual sales volume, rising 22% over the prior year. However, 2021’s sale numbers still pale in comparison to the peak year for sales volume experienced in 2005, 29% below this peak year.
Chart 3
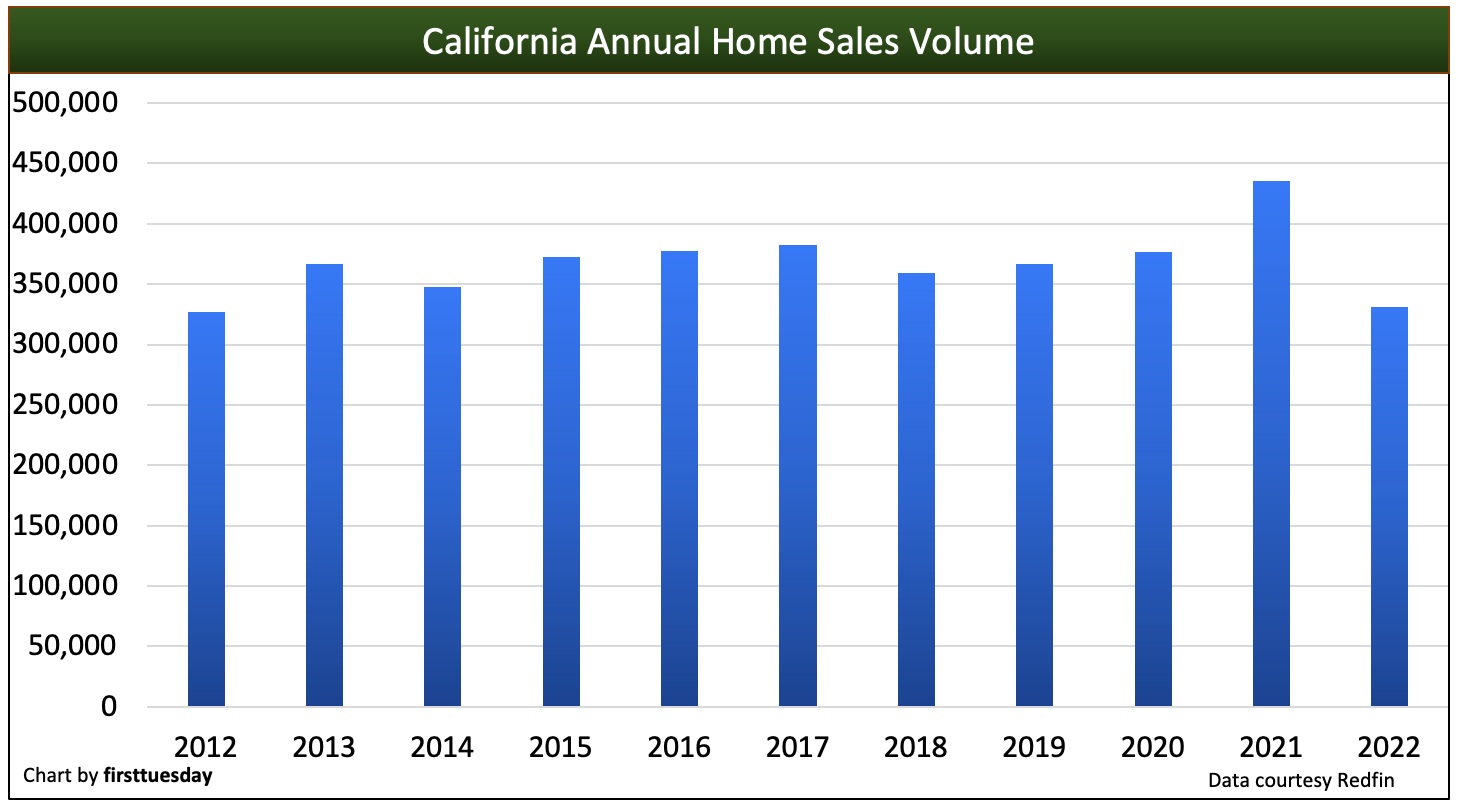
Chart update 01/30/23
| 2022 |
2021 | Annual change | |
| Annual home sales volume | 330,900 | 435,200 | -24% |
To set the stage for a forward look, a review of sales volume in the recent past is helpful:
- Mid-2005 saw sales volume peak for all types of real estate in California, with nearly 754,000 homes sold that year;
- Nearly 30% fewer sales were recorded in 2006 than in 2005, while sales dropped an additional 30% in 2007;
- sales bottomed in 2008 and were artificially inflated in 2009 due to subsidy-induced purchases and speculators jumping on the momentum, but remained 40% below 2005;
- 2010 saw a decline from the year earlier in both sales volume and prices;
- 2011 increased slightly in sales volume while decreasing in sales prices, a normal price adjustment condition;
- 2012 saw sales volume increase marginally and home prices jump significantly by year’s end, supported primarily by massive speculation;
- 2013 home sales volume stagnated, while home prices continued to increase rapidly, not a good sign for the immediate future; and
- 2014 saw home sales volume decrease throughout the year, ending the year 7% below 2013.
- 2015 ended 9% higher than 2014 — in other words, just about level with 2013. [See Chart 4]
- 2016 and 2017 sales volume continued a flat trend in sales which began in 2015;
- 2018 saw sales volume decrease rapidly in the fourth quarter, ending the year 4% below 2017;
- 2019 home sales volume decreased slightly from the prior year; and
- 2020 home sales were extremely volatile, dropping as much as 30% mid-year, but bouncing back sufficiently enough by Q3 and Q4 to make up for the loss, ending 2020 roughly level with 2019.
- 2021 home sales volume rose 22% over the prior year, spurred on by low interest rates and buyer fear-of-missing-out (FOMO) following a year of pandemic-slowed sales.
- 2022 home sales lost all ground gained in 2021, ending the year 24% below 2021 and 12% below 2019, the last “normal” year for home sales before the pandemic upended traditional market dynamics.
Chart 4
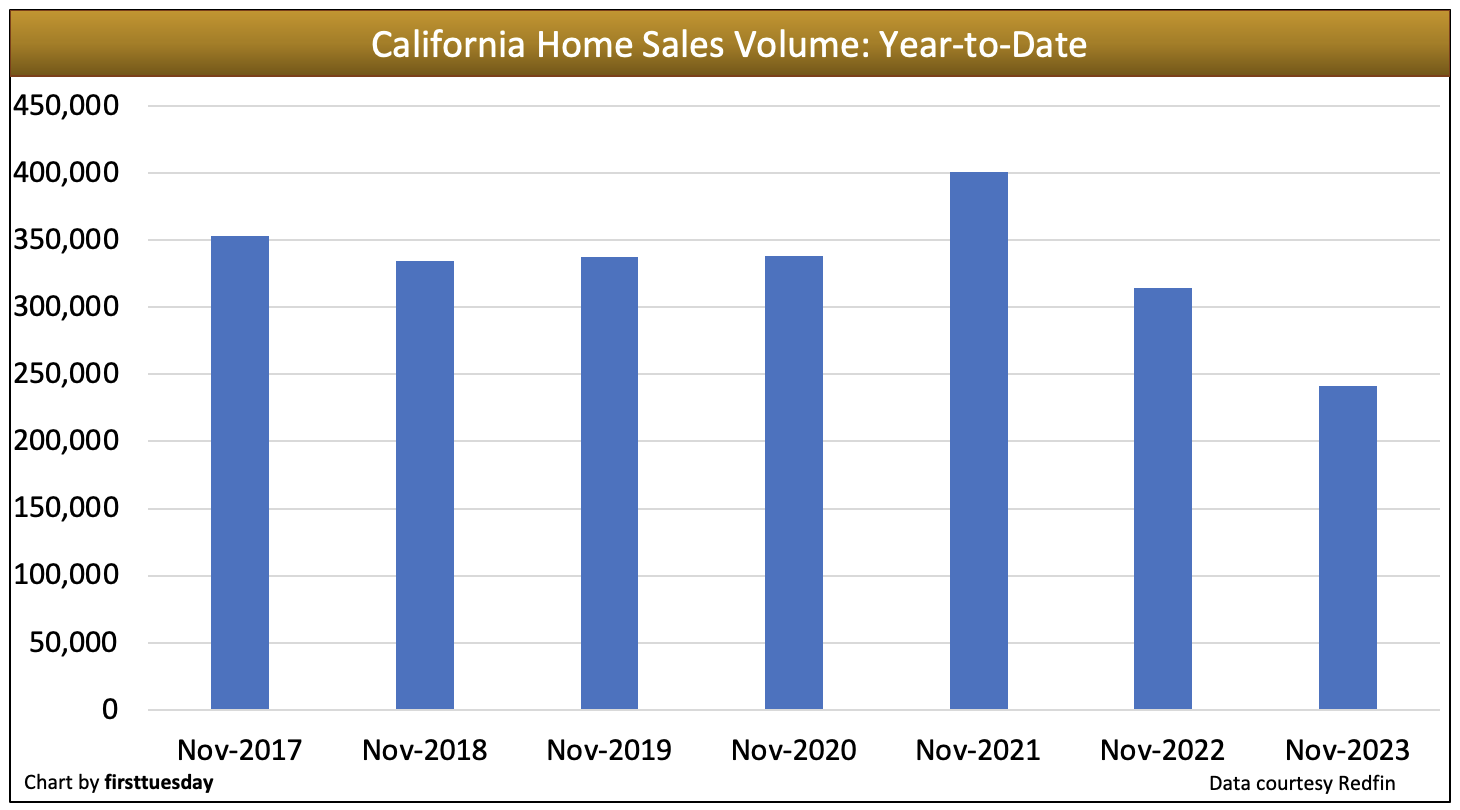
Chart update 01/03/24
| Nov 2023 | Nov 2022 | Nov 2021 | |
| Home sales volume year-to-date |
241,600 | 314,600 | 400,700 |
Year-to-date (YTD) home sales volume continues to fall back in recent months, following a 22% annual jump in 2021. As of November 2023, YTD home sales volume is 23% below a year earlier. Compared to 2019 (the last “normal” year for housing before the Pandemic Economy took over), home sales volume YTD is 28% lower as of November 2023.
Home sales volume will continue to fall back in 2024 due to:
- lower homeowner turnover due to rising mortgage interest rates;
- reduced home inventory across the state; and
- the 2023 recession, which is as yet undeclared, but is already being felt across the housing market.
Home prices have leveled off in mid-2022 and will soon fall, dragged down by significant cuts to buyer purchasing power.
When home prices fall, some California mortgaged homeowners will fall underwater. Thus, turnover by this chunk of owners will be restricted. These homeowners cannot sell and relocate to purchase another home because their homes are worth less than the debt encumbering them. To rid themselves of the home and the debt, they have to endure damaged credit resulting from a short sale or foreclosure. The desire to avoid this embarrassment takes most of these 3.2% homeowners out of the home buying market for years.
Home sales in the coming years
The forward trend in California home sales is mixed for both buyers and seller. Homebuyer income is going further and doing more than anytime during the past 15 years due to increased borrowing capacity brought on by low interest rates, at historic lows in May 2020.
first tuesday forecasts home sales volume will languish in 2020-2021, the result of an unstable jobs market. The peak sales volume last seen in 2004, inflated by speculator acquisitions and excessive mortgage money, is unlikely to return for decades, when interest rates cyclically peak.
Relocating Baby Boomers going into retirement in the coming years will be the primary propelling force in both selling homes and buying replacements. Their Generation Y (Gen Y) children will add to the sales volume at the same time as they find jobs at better pay levels and become first-time homebuyers. Gen Y influence will peak in sales volume at the end of this decade as they complete their shift from renting to owning.
Once California’s job market rebounds from the current recession, their confidence about the future will improve. They will once again be willing to invest in the economy since the expectations for tomorrow are projections based on yesterday’s most recent experience. Only then will occupying homebuyers – end users – return in sufficient numbers for sales volume to swell significantly.
Employment and labor force participation finally exceeded their 2007 peak in 2019, but what took over a decade to recover was lost in a matter of weeks due to COVID-19-induced lay-offs. Expect home sales volume to decrease along with jobs through the rest of 2020 and 2021.
Trends to be concerned about
Many long-term unfavorable market conditions restrain the rise of home sales volume:
- the weakest homebuyer demographics in 15 years;
- failed savings for a down payment as high rents squeeze potential first-time homebuyers out of saving;
- buyer borrowing power no longer enlarging the funds they can borrow as interest rates inevitably rise, reducing funding for purchase-assist financing and dampening property prices;
- the public’s increasingly anti-business and pessimistic attitude about American economics, wealth inequality and national politics no matter the outcomes; and
- tightened loan standards as lenders are forced to apply forgotten fundamentals of sound mortgage lending practices (20% down payment on non-FHA/private mortgage insured loans, lower income ratios, risk-free credit scores and full documentation of income, funds and collateral value).
The competitive broker
What’s a broker to do until home sales volume takes off?
SFR brokers and agents might consider adding SFR-related services to supplement their income. Those who do add related services will restructure their practice as “all-service brokers.” Transaction-related services will be integrated into their office operations to maintain solvency and grow.
Related article:
These services include:
- escrowing their in-house transactions under the broker’s license;
- entering into or expanding property management services;
- negotiating equity purchases for investors from underwater owners on the chance of a short sale discount or who have a positive equity;
- specializing in sales and leasing of a particular type of commercial property, other branch office locations and alternative marketing approaches (aside from social media);
- providing mortgage loan broker services for business-investor loans made by private lenders and secured by the borrower’s residence (no mortgage loan origination (MLO) endorsement required);
- arranging carryback financing and the take over/assumption of existing mortgages, and buying and selling those carryback trust deed notes;
- negotiating options to buy, or lease with option to buy when inventories expand as the shadow inventory of speculators returns to be sold;
- exchanging properties with equity to help owners relocate their wealth held in real estate tax free; or
- using barter credits in lieu of greenbacks, etc.
Prudent brokers will insist their prospective buyers commit to exclusive representations by the broker and agent to locate a home (or other property). By signing an exclusive right-to-buy listing agreement, buyers commit to employ brokers and agents just as sellers commit to employ brokers and agents, the obverse side of the same employment coin. This will ensure time spent with a buyer produces a closing and a fee.
Causes for the rise and fallThe trend in California home sales during the initial years of the 2010s remains grim for sellers. Not so for buyers. Homebuyers’ dollars are going further than anytime during the past 15 years. Sales now and into 2014 will remain excessively lender-driven and speculator-riddled, but will be easily predictable for SFR agents and their brokers. The center of this action is the multiple listing service (MLS). To set the stage for a forward look, a review of sales volume in the recent past is needed:
Real estate owned property (REO) resales and speculators have contributed to sales volume oddities over the past few years. Conventional positive equity sales remain the exception. Lenders have turned increasingly to short sales in 2012, surpassing the number of foreclosures in California. Short sales will continue to make up roughly one-fourth of the home resale market in 2013. Going into 2013, sales volume is gradually recovering as speculators begin to exit the market, making room for buyer-occupants. The bounce loses energy and hunts for the floorSales volume will likely increase by 10% in 2013, due to slowly improving confidence and job numbers. Anticipate modest price increases to follow in 2014, falling back in 2016. In 2015, the Federal Reserve (the Fed) will need to raise short-term interest rates in order to keep a lid on the recovery (as they did in both 1984 and 1994). Expect the short-term rate to decline within one year, the 2016 period, at the end of a downward turn in real estate sales volume. Sales volume’s next big peak will occur in 2019-2020, with pricing following 12 months later.
The real estate market is now settling into a long recovery. For home sales volume to achieve the kind of dramatic but stable recovery which took place in the 1996 period following the 1990s real estate recession, employment will need to increase at the rates experienced in the mid-1990s: 350,000+ additional jobs created annually for three years. California’s labor force is inching back to that number, as a total of 700,400 jobs have been gained since employment was at its lowest in January 2010. However, as of October 2012, California is still 900,000 jobs short of the employment level before the Great Recession. Once Californians feel the effects of two or three years of healthy employment growth, their confidence about the future will improve. They will once again be willing to invest in the economy. Only then will end users return in sufficient numbers for sales volume to swell.
In 2017, sales volume will begin to pick up significantly, peaking in 2019-2020. Employment will have reached its 2007 peak, and will continue to grow quickly. 2017 will see home prices jump well beyond the rate of consumer inflation.Mortgage lenders with an eye for profits will then begin to loosen their lending standards to whatever extent federal regulators permit. The memory of the grim mid-2000s will be quickly pushed aside, and mistakes will be repeated. Factors leading to recoveryBeginning in 2016-2017, another wave of investors and an upsurge of household formations by first-time homebuyers, will kick-start sales volume. In turn, this will drive pricing momentum upward once again. Keep your eyes on homebuyer demand (not sellers, median prices or the MLS inventory). Real demand is driven by:
Favorable market conditions now at workMany favorable market factors are currently support increasing sales volume:
Trends to be concerned aboutHowever, many unfavorable market conditions restrain the rise of home sales volume:
The competitive brokerWhat’s a broker to do until home sales volume takes off? SFR brokers and agents can consider adding SFR-related services to supplement their income. Those that do add related services will restructure their practice as all-service brokers. Transaction-related services will be integrated into their office operations to remain solvent and grow. These services include:
Brokers can also insist that prospective buyers commit to exclusive representations by a broker and agent to locate a home (or other property). By signing an exclusive right-to-buy listing agreement, buyers are asked to employ brokers and agents just as sellers are asked to employ listing agents. This will ensure time spent with a buyer produces a closing and a fee. |

This post was originally published on 3rd party site mentioned on the title of this site